Distinct Count in SSAS

In some scenarios we may need to get the Distinct Count value. As an example we may need to get the items purchased from a particular supplier. In such scenario we need to get the distinct items from the purchase orders, since the same item will be available in different purchase orders.
For that below expression can be used.

   1: DistinctCount(Nonempty([Item].[Item].[Item].Members, [Measures].[Fact Purchase Count]))

FactPurchase is our Fact table which stores Purchase Order data and Item is the dimension which keeps Item information. By default when we create a Measure Group in the Cube, it automatically adds the Count measure. In the above expression what it does is, it joins the Item Dimension with that Count measure and get the distinct Items from it.

SQL Rank...

There was a situation that Suppliers needs to be ranked by the lowest Rate given for the Items in a particular Year. It can be easily done by using SQL Rank function.
Sample query is as below.

   1: SELECT YearKey,SupplierKey,ItemKey,
   2: RANK() OVER (PARTITION BY ItemKey,YearKey ORDER BY AvgRate ASC) AS RankByAverageRate
   3:   FROM FactPurchases
   4: GROUP BY YearKey,SupplierKey,ItemKey

This will rank the Suppliers using the AvgRate of the Item available for the Year.

Get the Top N records for a result set in MDX

In SQL Query we can easily get the Top N records for a result set. But we cannot use the same syntax in MDX.

Below query will show the Top 10 records of the result set.

   1: SELECT {[Measures].[Unit Price] } ON COLUMNS,NON EMPTY
   2: Head(NONEMPTY(CrossJoin([Item].[Item].[All] ,[Company].[Company].[All].Children) ),10) ON ROWS
   3: FROM [Cube]


TopCount and BottomCount in SSAS

In some scenarios we may want to get the lowest or highest dimension attributes using SSAS Cube. As an example we may need to get the 10 items with lowest unit price and the highest unit price.

In such kind of a scenario we can use the TopCount and BottomCount functions.

To get the 10 items with highest unit price, below expression can be used.

   1: TopCount
   2:     (
   3:     [Item].[Item].[Item].Members,
   4:     10,
   5:     [Measures].[Unit Price]
   6:     )

Likewise I used the BottomCount in the same way to get the 10 items with lowest unit price.
   1: BottomCount
   2:     (
   3:     [Item].[Item].[Item].Members,
   4:     10,
   5:     [Measures].[Unit Price]
   6:     )
But it I filter data for the Month, it only shows the values for the last month. For others no rows were displayed.
Actually this is due to the NULL values and to avoid it, NONEMPTY function was used.

   1: BottomCount
   2:    (NONEMPTY([Item].[Item].[Item].Members,{[Measures].[Unit Price]})
   3:    , 10
   4:    , [Measures].[Unit Price]
   5:    )

This shows the 10 items with lowest unit price for the selected filtering criteria.

Cube Optimization in SSAS

In a BI solutions, SSAS cube may contains billions of records. In such large volume of data, query processing will be crucial. End user wants to get the output without much delay and to cater that you need to optimize the query processing. Otherwise it may take minutes to get the query results.

Anyway before optimizing the cube, DW must be designed properly to get the good query performance. In this post, only the cube optimization is considered.
For cube optimization, two main approaches can be used

  • Partitioning
  • Aggregation Designing


Partitioning

Since there are large volumes of data, we can split those data of a measure group, into different portions by considering different attribute values. Those portions of data set of a measure group are called as partitions.
As an example we can create partitions considering the month value. For each month there will be different partitions under one measure group. Those partitions are not visible to the end user and the user will only see one measure group.
Creating partition will help to process partitions separately and if only one partitions gets changed, then only that partition can be processed without affecting other partitions. Therefore partitioning is making the maintenance of the cube much easier.

Aggregation Designing

By using aggregation designing, Cube keeps pre-calculated set of data. It will increase the query performance, since those calculations are already done in the query execution.
We can design aggregation using the below two methods in SSAS cube.

  1. Design Aggregations Wizard 
  2. Usage Based Optimization Wizard


Both of above wizards can generated using the Aggregations tab of the Cube in BIDS.
In the Design Aggregation options, we can set the thresholds for the required aggregations and it will automatically design aggregations according to those thresholds.

Usage Based Optimization method uses the executed queries and design aggregations based on those. In that approach, aggregations are designed based on the frequently used queries, which takes more time.

For the long run, Usage Based Optimization will provide more query performance for the end user, since it will design aggregations based on the used queries.

Used the below reference to identify the steps used in BIDS for those aggregation design methods.
Design Aggregation Wizard
Usage Based Optimization Wizard


The job failed. Unable to determine if the owner (Domain\User) of job SSISJob has server access...

I created a SSIS package, which connects to the SQL Server database using windows authentication.
Package run successfully when I executed it in the BIDS and I tried to schedule a job to execute the package.

When I tried to run the job, I got the below error message.

The job failed.  Unable to determine if the owner (Domain\User) of job SSISJob has server access (reason: Could not obtain information about Windows NT group/user 'Domain\User', error code 0x5. [SQLSTATE 42000] (Error 15404))

To fix it what I had to do is set the Log On account of the SQL Server Agent to a domain account.
Normally it is set for a built in account.
Then check whether the Owner of the job is set to the same domain user as the Log On account.

This fixed my problem and I was able to run the job successfully. 

Tips to avoid empty pages and white spaces in SSRS reports...

Sometimes we find that there are white spaces or empty pages in the SSRS report viewer output or the PDF output. In this post I am going to mention the tips we can use to avoid those.
  • Set the ConsumeContainerWhitespace property of the report to True.
  • Set the body content to fit enough for the Report Page Width. Consider the margins too. Body width + Left and Right margins needs to be less than the report page width. Otherwise there will be blank spaces while exporting to PDF.
  • Remove unwanted space between the tables or charts in the report.
  • Check the page breaks, and disable those if there are no data by checking the Count of the data set.
  • Set the page breaks if you are setting the visibility of a particular section by using a parameter, by applying the same condition for the Disable property.
If those things were done properly, there will not be any unwanted white spaces or empty pages in the report.

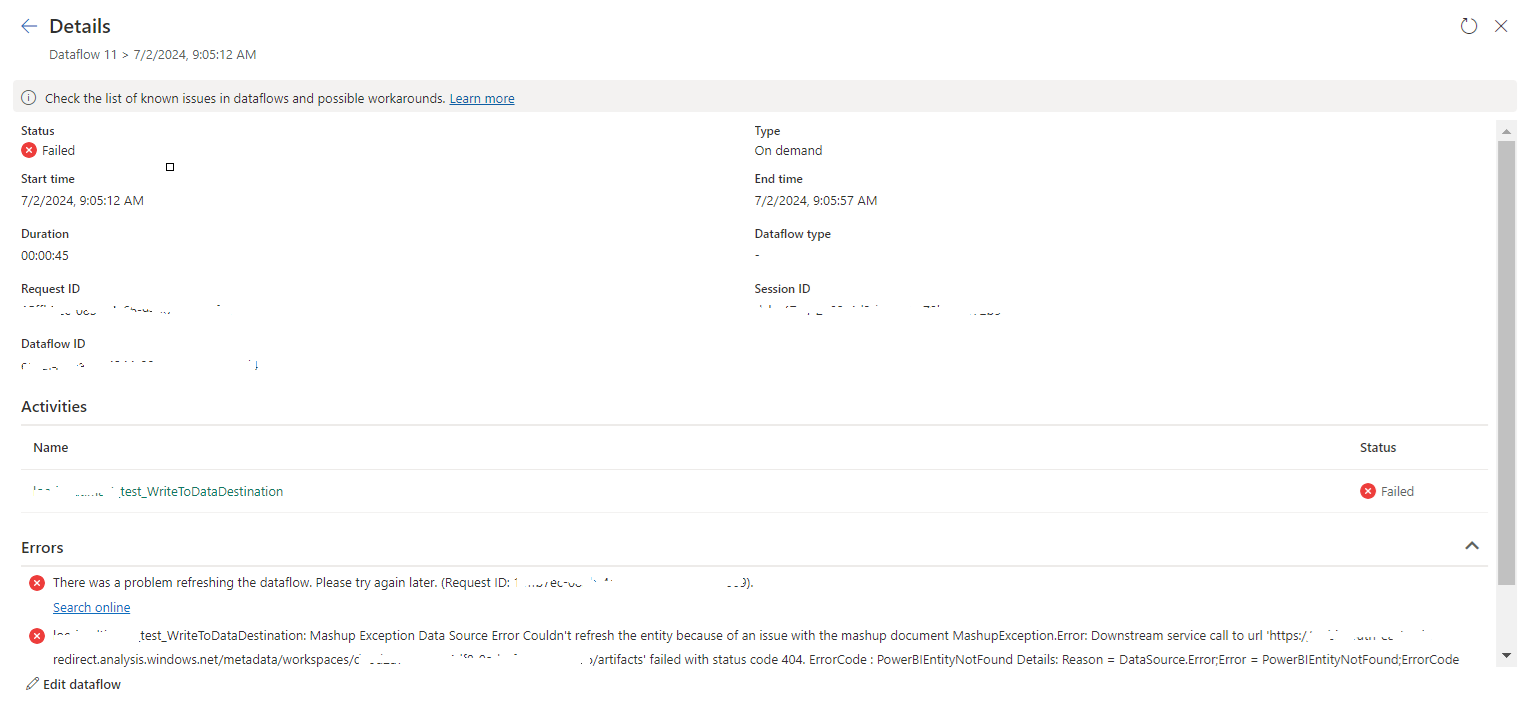
tablename_WriteToDataDestination: Mashup Exception Data Source Error Couldn't refresh the entity...

 Once a Dataflow is created and published on Fabric, got the below error while refreshing the Dataflow. tablename_ WriteToDataDestination: M...