tablename_WriteToDataDestination: Mashup Exception Data Source Error Couldn't refresh the entity...

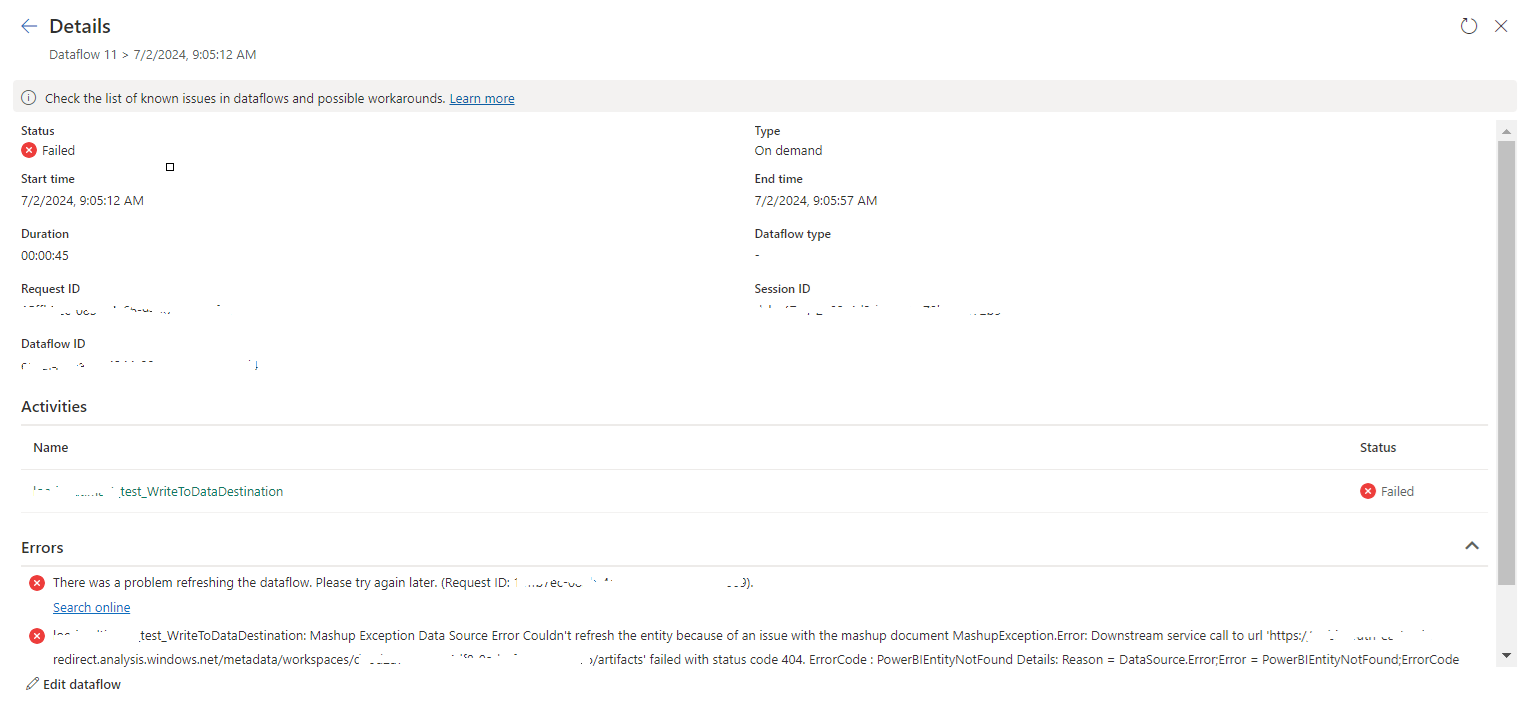
 Once a Dataflow is created and published on Fabric, got the below error while refreshing the Dataflow.

tablename_WriteToDataDestination: Mashup Exception Data Source Error Couldn't refresh the entity because of an issue with the mashup document MashupException.Error: Downstream service call to url 'https://xxxxxx.analysis.windows.net/metadata/workspaces/xxxxxxxxxxxxx/artifacts' failed with status code 404. ErrorCode : PowerBIEntityNotFound Details: Reason = DataSource.Error;Error = PowerBIEntityNotFound;ErrorCode = PowerBIEntityNotFound;RequestId = xxxxxxxxx;RequestUrl = https://xxxxxxxxxxx.analysis.windows.net/metadata/workspaces/xxxxxxxxxxxxxx/artifacts;ErrorMessage = PowerBIEntityNotFound;Microsoft.Data.Mashup.Error.Context = User GatewayObjectId: xxxxxxxxxxxx


This error is due to the destination is not set. Right click on the Dataflow query and select "Enable staging" as below. This will resolve the above issue.


Microsoft Fabric Notebook Execution: AnalysisException

While executing a Fabric Notebook, I got the below error.

AnalysisException: org.apache.hadoop.hive.ql.metadata.HiveException: MetaException(message:Spark SQL queries are only possible in the context of a lakehouse. Please attach a lakehouse to proceed.) 

The reason for this error is, I did not add the relevant Lakehouse to the Notebook.
We need to add the relevant Lakehouse as below:


After that you will not get the above error message.
Hope this will be helpful.


How to add a logo image to a Power BI report in Microsoft Fabric

There is no way to add an image directly to a Power BI report in Microsoft Fabric.
But, you can achieve it using an alternative approach as below.

  • Add a Blank Button

  • Go to the Format button section, then expand the Style under the Button section.


  • Then expand the Fill section


  • Click on Browse and select the image to be added.


  • Use the Image fit option as Fit


Hope this will be helpful...


How to run UPDATE/INSERT/DELETE Statements on Azure SQL Database in Microsoft Fabric Notebook...

You can run UPDATE/INSERT/DELETE Statements on Azure SQL Database in Microsoft Fabric Notebook using Python SQL Driver - pyodbc. 
For the Fabric Notebook, the driver is "{ODBC Driver 18 for SQL Server}"

Sample code is below:

import pyodbc
server = "servername.database.windows.net"
database = "databasename"
username = "user"
password = "password"
driver= "{ODBC Driver 18 for SQL Server}"

strsql = "Your SQL Statement"

with pyodbc.connect('DRIVER='+driver+';SERVER=tcp:'+server+';PORT=1433;DATABASE='+database+';UID='+username+';PWD='+ password) as conn:
    with conn.cursor() as cursor:
        cursor.execute(strsql)

How to execute a notebook from another notebook in Microsoft Fabric...

We can execute a notebook from another notebook in Microsoft Fabric

mssparkutils.notebook.run("child_notebook_name", 60, {"ParameterName": ParameterValue})

Data ingestion methods offered by Azure Synapse Analytics...

Azure Synapse Analytics offers several data ingestion methods and tools to facilitate the process of bringing data into your Synapse Analytics workspace. Here are some of the key data ingestion methods related to Azure Synapse Analytics:

  1. Azure Data Factory:
    • Definition: Azure Data Factory is a cloud-based ETL (Extract, Transform, Load) service that allows you to create, schedule, and automate data pipelines. It supports data movement and transformation from various sources to Azure Synapse Analytics.
    • Use Cases: Ingesting data from on-premises databases, cloud services, and various data stores into Synapse Analytics.
    • Integration: Azure Data Factory provides built-in connectors to Azure services and supports custom data connectors.
    • Advantages: Scalability, workflow orchestration, data transformation capabilities, and integration with Azure services.
  2. Azure Data Factory Data Flows:
    • Definition: Azure Data Factory Data Flows is a visual data transformation feature within Azure Data Factory. It allows you to build data transformation logic using a low-code/no-code approach, making it easier to prepare data for ingestion.
    • Use Cases: Data cleansing, enrichment, and transformation before ingesting into Synapse Analytics.
    • Integration: Seamlessly integrates with Azure Data Factory pipelines.
    • Advantages: Simplified data transformation, graphical interface, and integration with other Azure services.
  3. Azure Logic Apps:
    • Definition: Azure Logic Apps is a cloud-based workflow automation platform that enables you to create workflows to connect and integrate data and services from various sources, including external APIs and applications.
    • Use Cases: Triggering data ingestion based on events or conditions, integrating with external data sources.
    • Integration: Connects to a wide range of services and systems, including Synapse Analytics.
    • Advantages: Workflow automation, event-driven data ingestion, and support for external integrations.
  4. Azure Blob Storage and Azure Data Lake Storage Gen2:
    • Definition: Azure Blob Storage and Azure Data Lake Storage Gen2 are cloud storage solutions that can be used for storing raw data files. These storage solutions can serve as landing zones for data before processing and ingestion into Synapse Analytics.
    • Use Cases: Storing data files from various sources before ETL processing.
    • Integration: Native integration with Synapse Analytics.
    • Advantages: Scalable storage, cost-effectiveness, and compatibility with various data formats.
  5. PolyBase:
    • Definition: PolyBase is a feature within Azure Synapse Analytics that allows you to query and import data from external sources such as Azure Blob Storage, Azure Data Lake Storage, and on-premises SQL Server databases.
    • Use Cases: Querying and importing data from external data sources directly into Synapse Analytics.
    • Integration: Built-in feature of Synapse Analytics.
    • Advantages: Direct querying and importing of external data, reducing the need for complex ETL processes.
  6. Azure Data Share:
    • Definition: Azure Data Share is a service that allows you to share data between Azure services and with external organizations securely. You can use it to share data from your Synapse Analytics workspace with other Azure users or tenants.
    • Use Cases: Sharing data with collaborators, partners, or other Azure services.
    • Integration: Integration with Azure Synapse Analytics for data sharing.
    • Advantages: Secure data sharing, control over data access, and collaboration capabilities.

These data ingestion methods provide a range of options for bringing data into Azure Synapse Analytics, depending on your specific needs and the source of your data. You can choose the method that best fits your data integration requirements and workflow.

How to create an Azure Synapse Analytics workspace...

 Creating an Azure Synapse Analytics workspace involves several steps. Here's a step-by-step guide on how to create one:

1. Log in to Azure Portal:

  • Visit the Azure Portal.
  • Log in with your Azure account credentials.

2. Create a Resource Group (Optional):

  • You can choose to create a new resource group or use an existing one to organize your Synapse Analytics workspace and related resources.

3. Create a Synapse Analytics Workspace:

  • Click the "+ Create a resource" button in the Azure Portal.
  • In the search bar, type "Azure Synapse Analytics" and select it from the results.

4. Configure Synapse Analytics Workspace:

  • In the "Azure Synapse workspace" pane, click the "Create" button.

5. Basics:

  • Fill in the basic information for your workspace:
    • Workspace name: Choose a unique name for your workspace.
    • Subscription: Select your Azure subscription.
    • Resource group: Choose the resource group created in step 2 or create a new one.
    • Region: Select the Azure region where you want to deploy your Synapse Analytics workspace.

6. Security + networking:

  • Configure network settings, firewall rules, and virtual network integration based on your organization's requirements. You can choose to allow Azure services and resources to access this workspace and specify IP firewall rules.

7. Advanced:

  • Under the "Advanced" tab, you can configure settings related to system-managed private endpoints, Power BI integration, and private endpoint connections.

8. Review + Create:

  • Review the settings you've configured to ensure they are accurate.
  • Click the "Create" button to start the deployment process. Azure will validate your settings.

9. Deployment:

  • Azure will begin deploying your Synapse Analytics workspace. This process may take several minutes to complete.

10. Access Your Workspace: Once the deployment is successful, you can access your Azure Synapse Analytics workspace using the Azure Portal or other tools like Azure Synapse Studio. You'll need to configure authentication and access permissions as per your organization's policies.

11. Additional Configuration (Optional): You can further customize your Synapse Analytics workspace by adding data, configuring security, and setting up data pipelines as needed for your specific use case.

That's it! You've successfully created an Azure Synapse Analytics workspace. You can now start using it to build and manage your modern data warehouse, perform data analytics, and run data processing workloads.

Why Azure Synapse Analytics is a powerful choice for building a modern data warehouse?


Azure Synapse Analytics is a powerful choice for building a modern data warehouse for several compelling reasons:

  1. Unified Analytics Platform: Azure Synapse Analytics combines both data warehousing and big data analytics into a single unified platform. This means you can store, process, and analyze structured and unstructured data in one place, eliminating the need for separate systems.
  2. Scalability: It offers on-demand scalability, allowing you to scale compute resources up or down based on workload demands. This flexibility ensures optimal performance while managing costs efficiently.
  3. Integration with Azure Services: Azure Synapse Analytics seamlessly integrates with other Azure services, such as Azure Data Lake Storage, Azure Databricks, Azure Machine Learning, and Power BI. This integration simplifies data pipelines, analytics workflows, and data visualization.
  4. Data Ingestion and Transformation: Azure Synapse Analytics provides various tools for data ingestion and transformation, including Azure Data Factory, Azure Databricks, and Synapse Pipelines. These tools enable you to ingest data from a wide range of sources and perform ETL (Extract, Transform, Load) operations efficiently.
  5. Built-in Data Warehousing: It includes a built-in, dedicated SQL pool for data warehousing, making it easy to set up and manage your data warehouse. You can create data models and schema-on-read or schema-on-write, depending on your needs.
  6. Advanced Analytics and Machine Learning: Azure Synapse Analytics supports advanced analytics, machine learning, and AI capabilities. You can leverage Spark-based processing for big data analytics and integrate machine learning models into your data warehouse workflows.
  7. Security and Compliance: Azure Synapse Analytics offers robust security features, including Azure Active Directory (Azure AD) integration, encryption at rest and in transit, and role-based access control. It is compliant with various industry standards and regulations.
  8. Real-time Analytics: It supports real-time data processing and analytics, enabling you to make data-driven decisions based on the most up-to-date information.
  9. Serverless On-Demand Querying: With serverless SQL pools, you can run ad-hoc queries on your data without the need to provision and manage dedicated resources. This feature is cost-effective and convenient for occasional querying needs.
  10. Monitoring and Management: Azure Synapse Analytics provides comprehensive monitoring and management tools through Azure Monitor and Azure Synapse Studio, making it easy to monitor performance, troubleshoot issues, and optimize workloads.
  11. Cost Optimization: It separates compute and storage costs, allowing you to independently scale and manage resources, which can lead to significant cost savings. You only pay for the compute resources you use during query execution.

In summary, Azure Synapse Analytics offers a fully integrated, scalable, and flexible platform for building modern data warehouses. Its seamless integration with other Azure services, support for advanced analytics, security features, and cost-efficiency make it a powerful choice for organizations looking to harness the full potential of their data.

Concept of a Modern Data Warehouse...

 A modern data warehouse is a cutting-edge approach to data management and analytics that combines traditional data warehousing concepts with modern technologies and practices. It is designed to efficiently collect, store, process, and analyze vast amounts of data from various sources to support data-driven decision-making in real-time or near-real-time.

Key characteristics of a modern data warehouse include:

  1. Scalability: Modern data warehouses are designed to scale horizontally or vertically to handle the growing volume of data. They can seamlessly adapt to changing business needs.
  2. Integration: They integrate data from diverse sources, including structured and unstructured data, on-premises and cloud-based sources, IoT devices, and more.
  3. Data Processing: Modern data warehouses use advanced processing techniques, such as distributed computing, parallel processing, and in-memory analytics, to handle complex data transformations and queries quickly.
  4. Advanced Analytics: They support a wide range of analytics, including machine learning, artificial intelligence, and predictive analytics, allowing organizations to extract valuable insights from their data.
  5. Real-time Data: Many modern data warehouses offer real-time data processing capabilities, enabling businesses to make decisions based on the most up-to-date information.
  6. Cost Efficiency: They are designed to optimize cost by separating storage and compute, allowing users to pay only for the resources they consume.
  7. Security and Compliance: Modern data warehouses prioritize data security and compliance with features like encryption, role-based access control, and auditing.
  8. Self-Service BI: They often include self-service business intelligence tools that empower non-technical users to explore and visualize data independently.

Overall, a modern data warehouse is a flexible and powerful platform that empowers organizations to harness the full potential of their data for better decision-making and competitive advantage. It serves as the foundation for modern data-driven enterprises.

AI image generation with Python

AI image generation, also known as generative art, involves using machine learning algorithms to generate images that are not directly copied from existing images, but rather created by the AI model itself. Python, as a popular programming language for machine learning and image processing, offers several libraries that can be used for AI image generation. Here are a few examples:

  1. Deep Dream (TensorFlow): Deep Dream is an image generation technique developed by Google that uses convolutional neural networks (CNNs) to generate surreal and dream-like images. TensorFlow, a popular deep learning library, provides an implementation of Deep Dream that can be used for AI image generation. You can find example code and tutorials on how to use Deep Dream with TensorFlow on the TensorFlow GitHub repository.
  2. DCGAN (Deep Convolutional Generative Adversarial Networks) (Keras): DCGAN is a popular type of generative model that uses adversarial training to generate images. Keras, a high-level neural networks library in Python, provides an implementation of DCGAN that can be used for image generation. You can find example code and tutorials on how to use DCGAN with Keras on the Keras GitHub repository.
  3. PyTorch (GANs and Variational Autoencoders): PyTorch, another popular deep learning library in Python, provides tools for building and training generative models, such as Generative Adversarial Networks (GANs) and Variational Autoencoders (VAEs), which can be used for AI image generation. PyTorch has a large community with abundant code examples and tutorials available on the official PyTorch website and GitHub repository.
  4. StyleGAN (TensorFlow): StyleGAN is a state-of-the-art generative model developed by NVIDIA that is capable of generating high-quality images with fine-grained control over their style and content. TensorFlow provides an implementation of StyleGAN that can be used for AI image generation. You can find example code and tutorials on how to use StyleGAN with TensorFlow on the NVIDIA GitHub repository.

These are just a few examples of the many options available for AI image generation with Python. Depending on your specific requirements and creative goals, you may choose different libraries or techniques that suit your needs. It's important to familiarize yourself with the chosen library and model, and experiment with different hyperparameters and settings to achieve the desired results.

How to create a job in DBT?

 DBT (Data Build Tool) is a popular open-source data transformation tool used for modern data analytics workflows. Here are the steps to create a job in DBT:

  1. Install and configure DBT: Before creating a job in DBT, you need to install DBT and configure your DBT project by setting up your profiles.yml and dbt_project.yml files. These files contain the necessary configurations for connecting to your data sources and defining your DBT project.
  2. Create a DBT project: You need to create a DBT project directory that contains your project files, such as SQL scripts, macros, and models. You can create a new DBT project using the following command in your terminal:
swift
dbt init <project_name>

Replace <project_name> with the name of your DBT project.

  1. Define your job: Inside your DBT project directory, create a new YAML file to define your job. You can name it as you like, for example, my_job.yml. In this YAML file, you define your job configuration, which includes specifying the models, the target schema, the data sources, and the operations you want to perform.

Here is an example of a simple job configuration in YAML format:

yaml
version: 2 name: my_job models: - my_model_1 - my_model_2 target: schema: my_target_schema

In this example, the job my_job is configured to run two DBT models (my_model_1 and my_model_2) and target a schema called my_target_schema.

  1. Run the job: You can run the job using the following command:
css
dbt run --project-dir <path_to_project_directory> --models <job_name>

Replace <path_to_project_directory> with the path to your DBT project directory and <job_name> with the name of your job, as defined in your YAML configuration file.

  1. Schedule the job: To schedule the job to run at specific intervals, you can use a task scheduler or a workflow management tool, such as cron, Airflow, or any other similar tool, to execute the dbt run command with the appropriate parameters.

That's it! You have successfully created a job in DBT. You can customize your job configuration and operations based on your specific data transformation requirements. DBT provides a wide range of features and configurations to manage your data transformation workflows efficiently.

Load data from Microsoft Dynamics Business Central to PowerBI

To load data from Microsoft Dynamics Business Central to PowerBI, you can use the PowerBI desktop application and follow these steps:

  1. Open PowerBI Desktop and click on "Get Data" in the Home tab.
  2. From the Get Data menu, select "OData Feed" and click "Connect".
  3. In the OData Feed dialog box, enter the URL of your Business Central OData endpoint. The URL format should be: https://<Business Central URL>/api/v1.0/companies(<Company ID>)/. Replace "<Business Central URL>" with the URL of your Business Central instance and "<Company ID>" with the ID of the company you want to connect to.
  4. Enter your Business Central credentials to connect to the OData endpoint.
  5. In the Navigator dialog box, select the tables and columns you want to import into PowerBI, and click "Load".
  6. The selected data will be loaded into PowerBI and you can start creating your reports and visualizations.

Note that you will need to have the correct permissions to access the data in Business Central. If you encounter any issues, you may need to check with your Business Central administrator to ensure you have the correct access rights.

How to connect to a Blob container using Snowflake

To connect to a Blob container in Snowflake, you will need to create a stage that points to the container. A stage represents a location where data files are stored, either within Snowflake or externally.

To create a stage that points to a Blob container in Snowflake, you can use the CREATE STAGE statement. Here is an example of how to create a stage for a Blob container in Azure Storage:


CREATE STAGE my_stage 
TYPE = AZURE_BLOB_STORAGE 
URL = 'https://myaccount.blob.core.windows.net/mycontainer'
CREDENTIALS = (AZURE_SAS_TOKEN =
'my_sas_token');

Replace my_stage with the name you want to give to the stage, myaccount with your Azure Storage account name, mycontainer with the name of the Blob container, and my_sas_token with a Shared Access Signature (SAS) token that grants Snowflake access to the container.

Once you have created the stage, you can use a COPY statement to load data from the Blob container into a Snowflake table. Here is an example of how to load data from a CSV file in the Blob container into a Snowflake table:

COPY INTO my_table FROM @my_stage/myfile.csv
FILE_FORMAT = my_file_format;

Replace my_table with the name of the Snowflake table, my_stage with the name of the stage you created, myfile.csv with the path to the file in the container, and my_file_format with the name of a file format object that describes the format of the data in the file.

Hope this will be helpful.
How to create a notebook in Azure Databricks

 To create a notebook in Azure Databricks, follow these steps:

  1. Navigate to the Azure Databricks workspace and click the "Workspace" button in the left panel.
  2. In the "Workspace" page, click the "Create" button, and then select "Notebook" from the dropdown menu.
  3. On the "Create Notebook" page, enter a name for the notebook and select the language for the notebook (e.g. Python, Scala, R).
  4. (Optional) Select a cluster to attach the notebook to. If you don't select a cluster, the notebook will be created in an "Automatic" cluster, which is a temporary cluster that is created on the fly when you run the notebook.
  5. Click the "Create" button to create the notebook.

You can then start writing code in the notebook by clicking in the first cell and typing your code. To run a cell, you can either click the "Run" button in the toolbar, or you can use the keyboard shortcut Shift + Enter.

Hope this will be helpful.


How to create a Data Factory pipeline

 To create a pipeline in Azure Data Factory, follow these steps:

  1. Navigate to the Azure Data Factory dashboard in the Azure portal.
  2. Click the "Create pipeline" button.
  3. On the "Create Pipeline" page, enter a name for the pipeline and a description (optional).
  4. Click the "Add activity" button to add an activity to the pipeline. An activity represents a data movement or data transformation operation in the pipeline.
  5. Select the type of activity you want to add. There are several types of activities to choose from, including data movement activities (e.g. Copy Data, HDFS) and data transformation activities (e.g. Wrangle Data, Mapping Data Flow).
  6. Configure the settings for the activity. This will vary depending on the type of activity you are adding.
  7. Repeat steps 4-6 to add additional activities to the pipeline as needed.
  8. Connect the activities in the pipeline by dragging the arrow from one activity to the next.
  9. When you are finished building the pipeline, click the "Save" button to save the pipeline.

You can then schedule the pipeline to run on a regular basis by clicking the "Trigger" button on the pipeline's overview page.

Hope this will be helpful.


How to take a screenshot on Mac

To take a screenshot on a Mac, you can use one of the following keyboard shortcuts:

  • Press Shift + Command + 3 to take a screenshot of the entire screen. The screenshot will be saved as a PNG file on your desktop.
  • Press Shift + Command + 4 to take a screenshot of a selected area. The cursor will change to a crosshair, which you can use to select the area of the screen you want to capture. When you have selected the area, release the mouse button or trackpad to take the screenshot. The screenshot will be saved as a PNG file on your desktop.
  • Press Shift + Command + 4 and then press the space bar to take a screenshot of a window. The cursor will change to a camera icon, which you can use to select the window you want to capture. When you have selected the window, click the mouse button or trackpad to take the screenshot. The screenshot will be saved as a PNG file on your desktop.

You can also use the built-in Grab app to take a screenshot on a Mac. To do this, open the Grab app (which is located in the Utilities folder in the Applications folder), and then choose one of the capture options from the "Capture" menu.

Hope this will be helpful.

tablename_WriteToDataDestination: Mashup Exception Data Source Error Couldn't refresh the entity...

 Once a Dataflow is created and published on Fabric, got the below error while refreshing the Dataflow. tablename_ WriteToDataDestination: M...